10x Genomics
Single Cell Gene Expression
Cell Ranger, printed on 07/19/2025
What's New in Loupe Cell Browser 3.0
Loupe Cell Browser 3.0 has been updated to allow users to easily analyze data generated with the upcoming Feature Barcoding technology for Gene Expression and Immune Profiling applications, as well as from the new Chromium™ Single Cell ATAC solution.
To find out how to use Loupe Cell Browser 3.0 to analyze single-cell chromatin accessibility data from Cell Ranger ATAC, please consult the Loupe Cell Browser ATAC documentation.
Compatibility with Cell Ranger and Previous Loupe Versions
Loupe Cell Browser 3.0 can view .cloupe files generated by Cell Ranger 1.3 and later, and is
required for viewing .cloupe files generated by Cell Ranger 3.0 and later. Files saved
within Loupe Cell Browser version 3.0.0 and later will not be readable by versions 1.0.x or 2.0.x of Loupe
Cell Browser.
Gene Expression and Immune Profiling Applications
Feature Barcoding Support

Loupe Cell Browser 3.0 includes support for Feature Barcoding applications. It can display counts generated by Cell Ranger 3.0 from all Feature Barcoding analytes, such as cell surface markers, peptide-MHC multimer binding, and CRISPR guide RNAs. Loupe Cell Browser also makes it possible to view t-SNE plots derived from feature barcodes, identify the most enriched feature barcoded analytes from a cluster of cells, or even determine the most preferentially bound antigens from cells with the same clonotype. For more information on how to use Loupe Cell Browser for Feature Barcoding applications, consult the Gene Expression Feature Barcoding and Immune Profiling Analysis with Feature Barcoding tutorials.
Multi-Species Support
Cell Ranger 3.0 now generates a .cloupe file for multi-species experiments run with a joint
reference. Loupe Cell Browser will compute an aggregate transcriptome expression count per cell,
to allow for easy segmentation by species, or joint analysis for host-virus applications.
Aggregate Feature Sums
Starting with Cell Ranger 3.0, .cloupe files include aggregate feature sums, such as the total
number of cell surface markers detected per cell, total number of guide RNAs per cell, and total
number of counts associated with a custom condition in a Feature Barcoding reference file. Typing
"Sum" into any of the feature autocomplete boxes should show the full range of sums available.
Sums are not available for .cloupe files generated with Cell Ranger 2.2 and earlier.
Improvements For All Applications
Feature Plot View
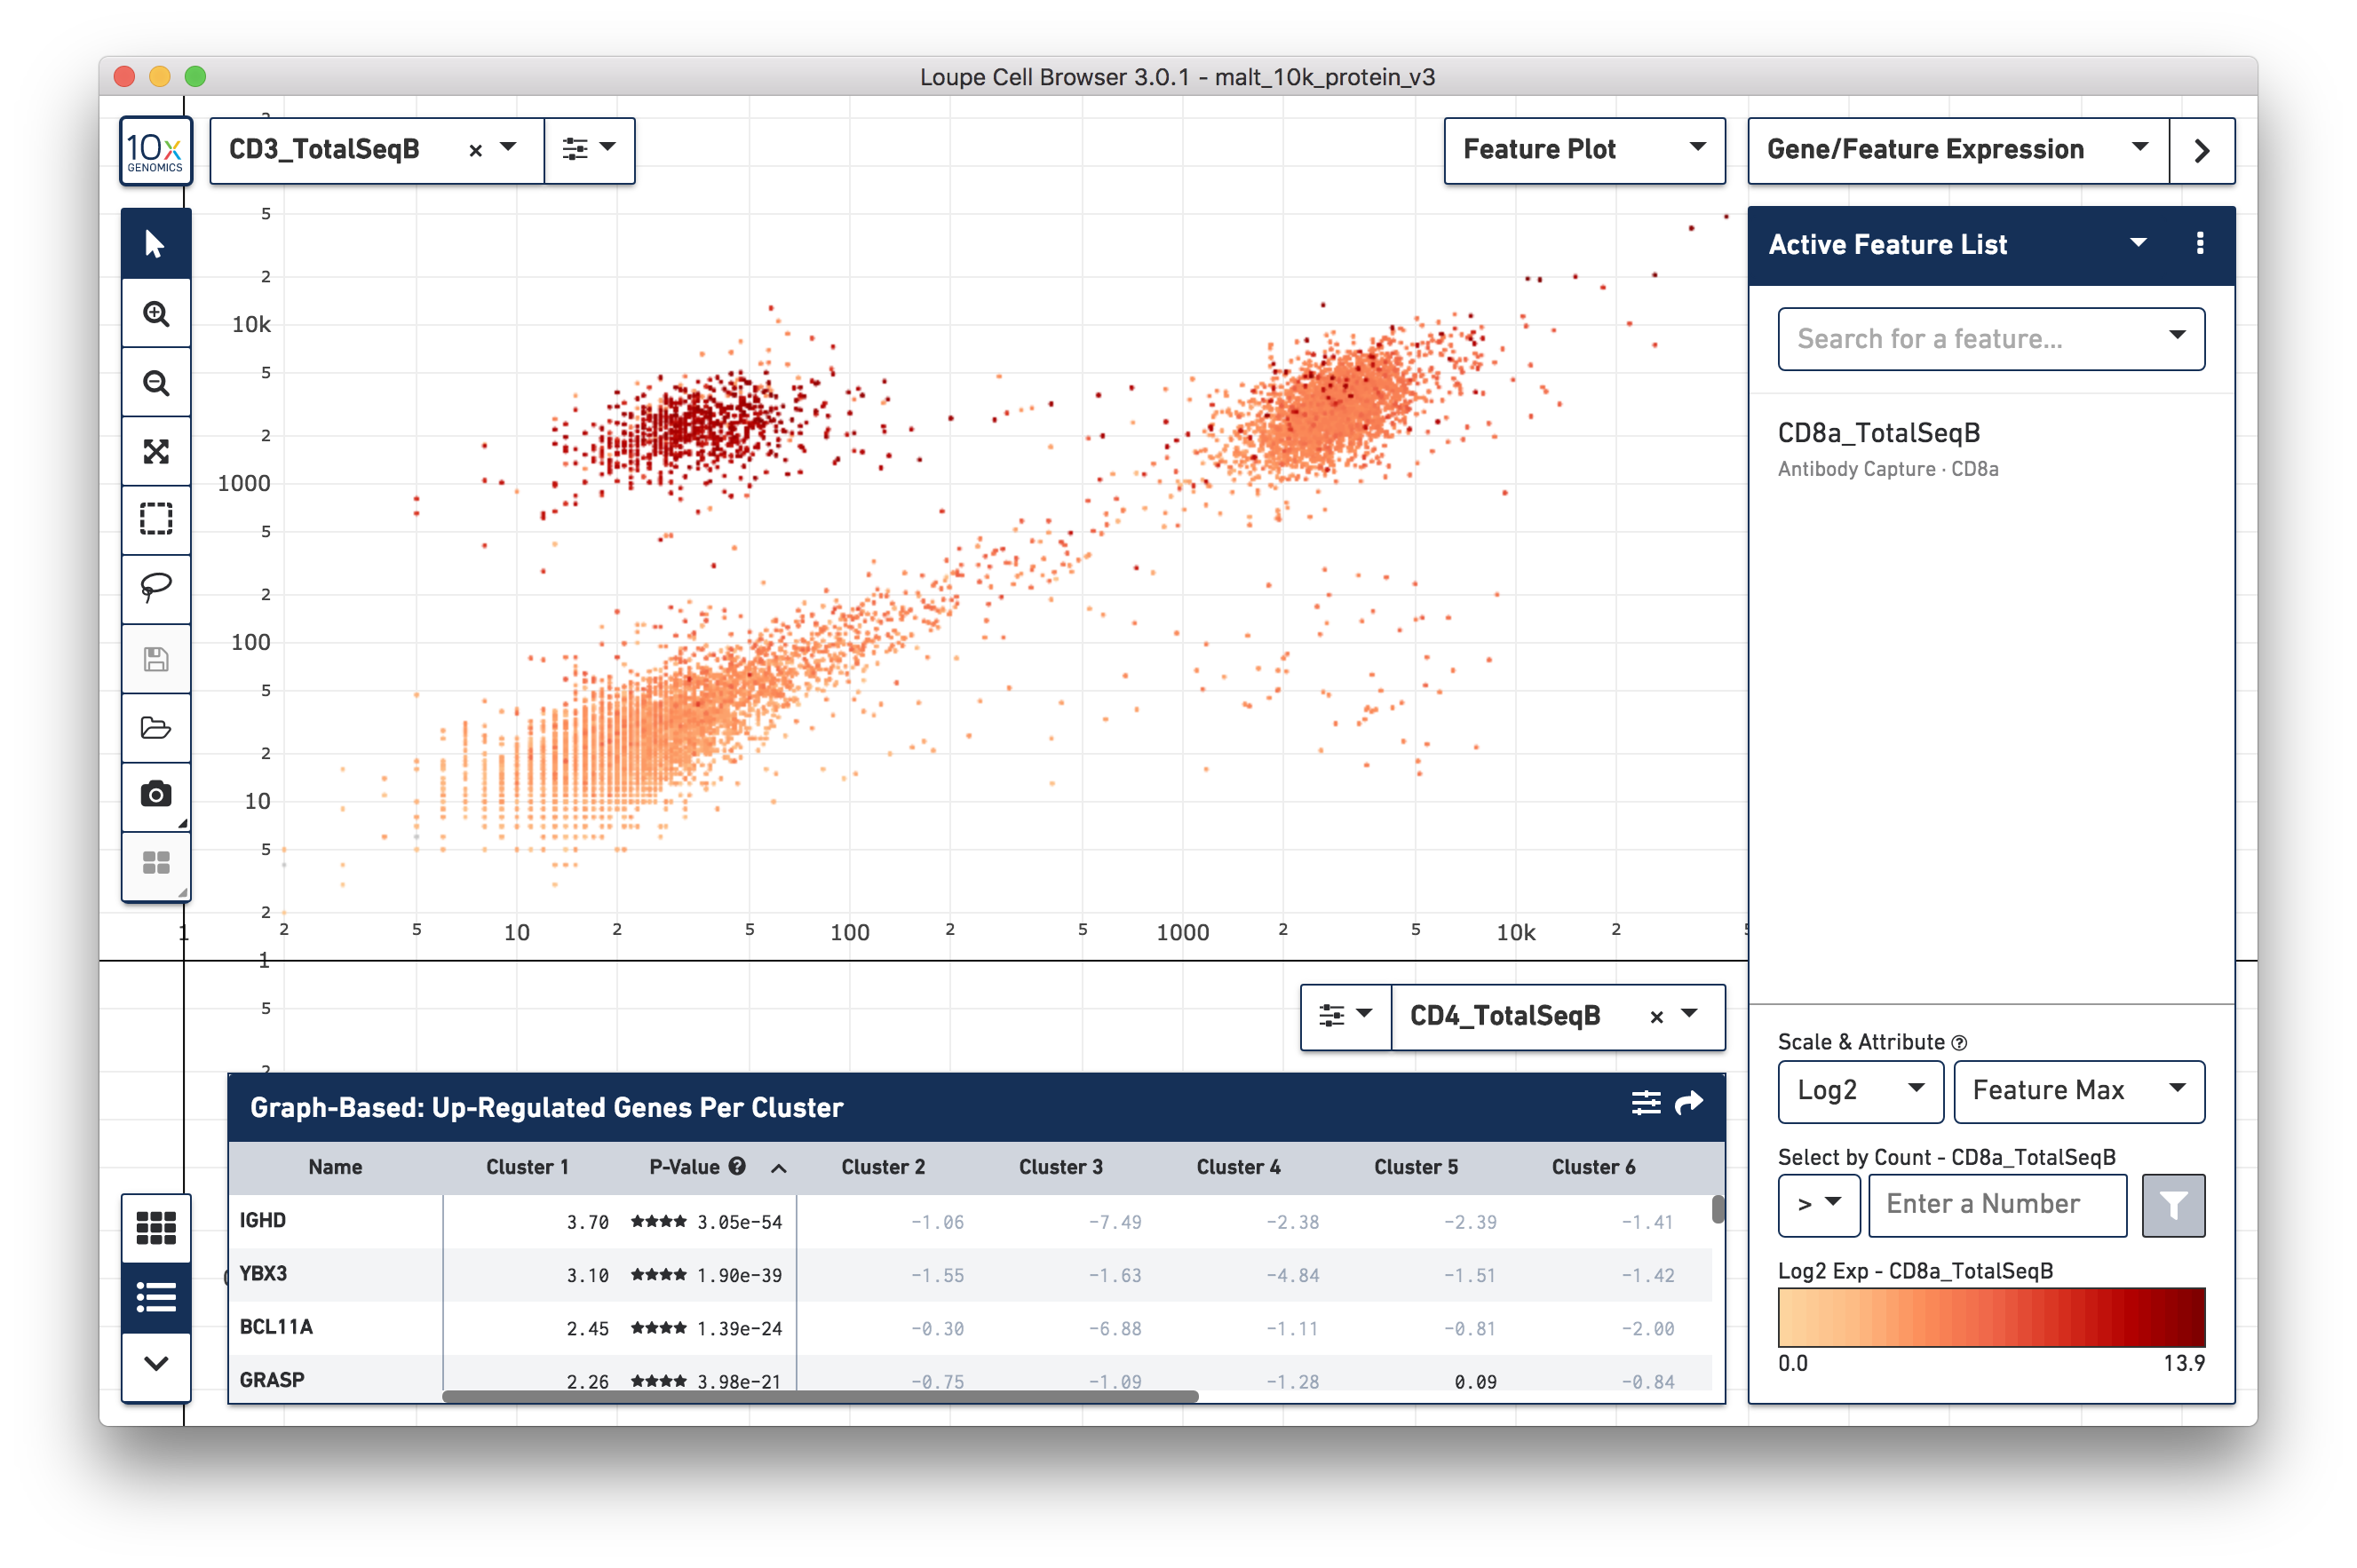
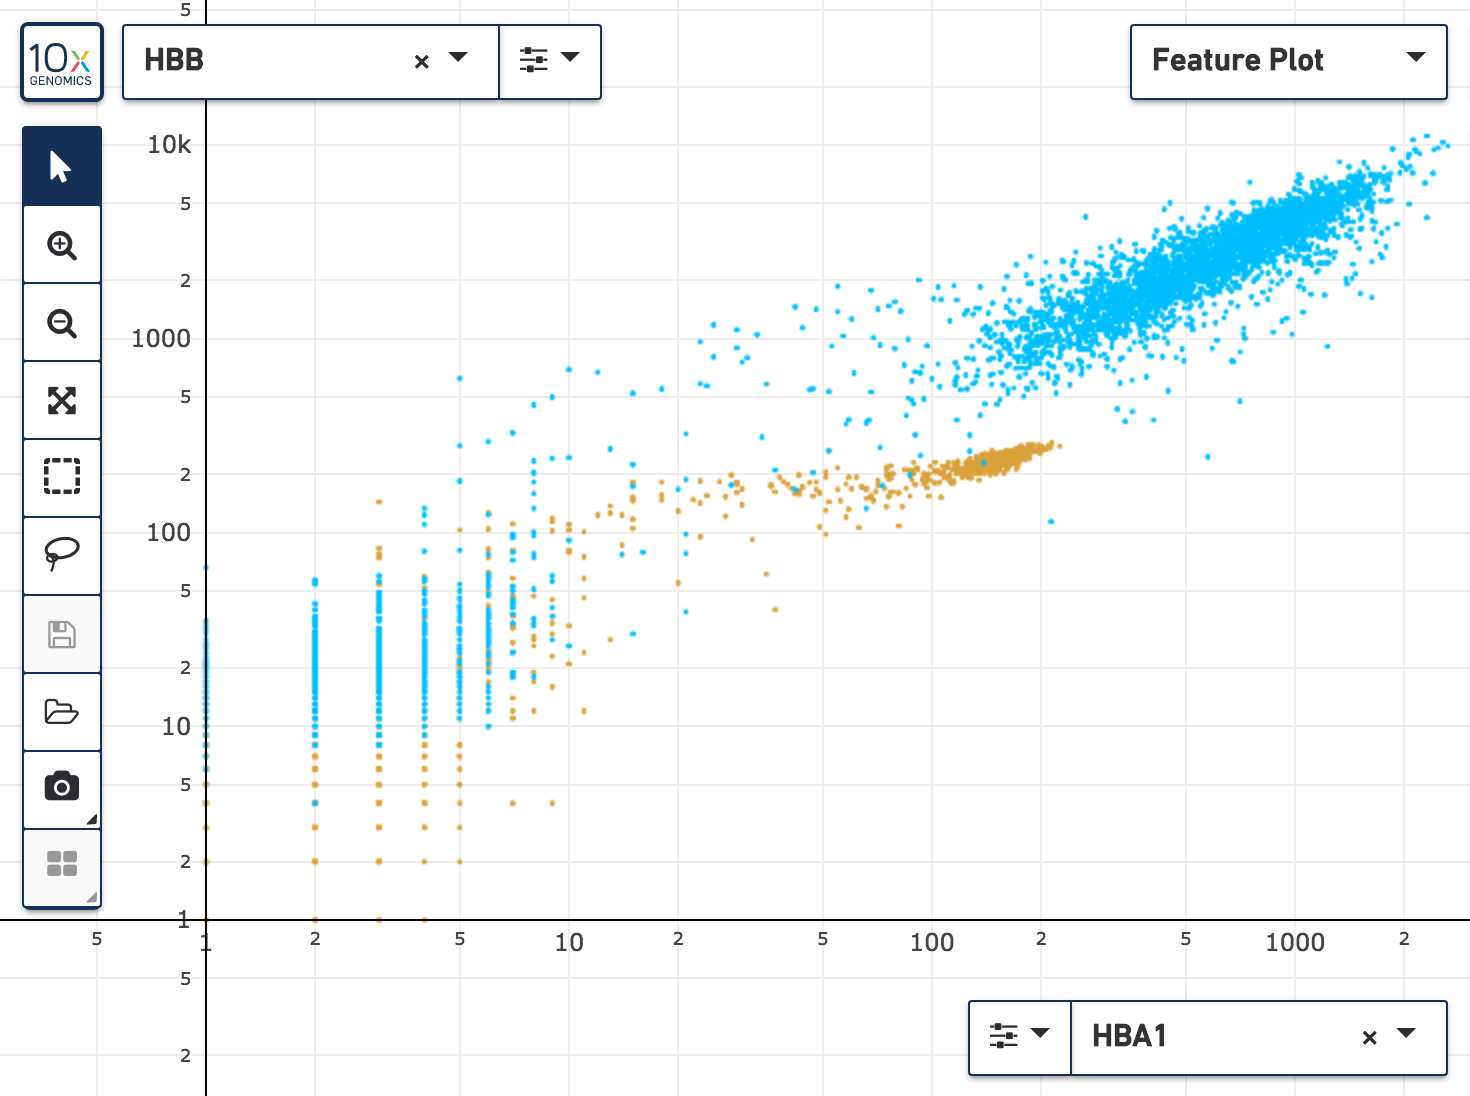
The new Feature Plot, available via the new projection selector at the top of the window, makes it possible to graph barcodes by one or two features at a time.

Individual features and aggregated feature sums as computed by the Cell Ranger 3.0 and Cell Ranger ATAC pipelines may be plotted in the Feature Plot. The Feature Plot makes it easier to identify cells with high relative expression, to define thresholds for one or two features, and to isolate positive cell populations against negative controls. Both linear and log scales are supported, and it is possible to can color cells in the Feature Plot in the same manner as the t-SNE plots.
Export Projections to SVG
Clicking on the camera icon in the toolbar now shows a menu with actions to export to either PNG or SVG format. Export to SVG format to save the active plot (including axes) for inclusion in papers or higher-resolution contexts. Export to SVG functionality is limited to datasets with 100,000 cell barcodes or lower.
Split View
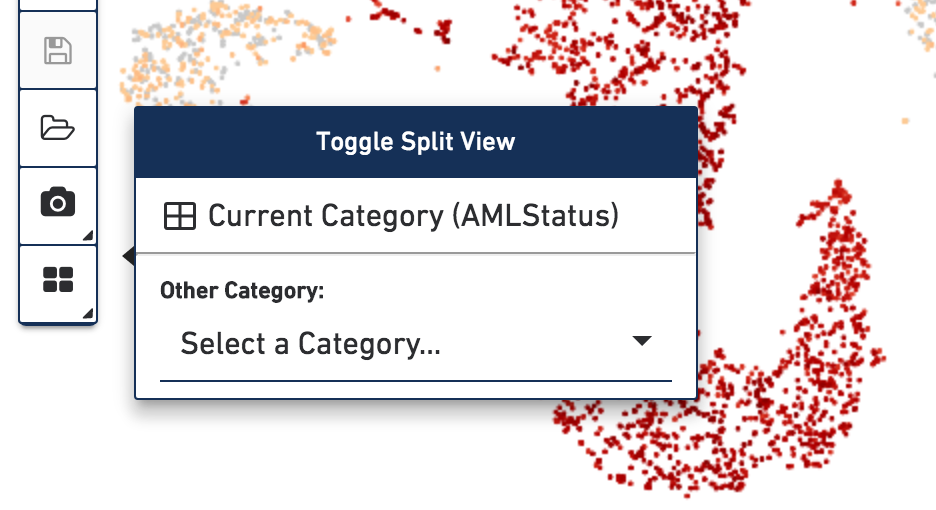
Split View is now accessible via the toolbar, rather than in the Categories panel. Click on the bottom button on the toolbar to bring up Split View options:

It is now possible to segment t-SNE plots by any category through the Split View menu, even outside Categories mode.
Selecting Genes and Features from the Feature Table
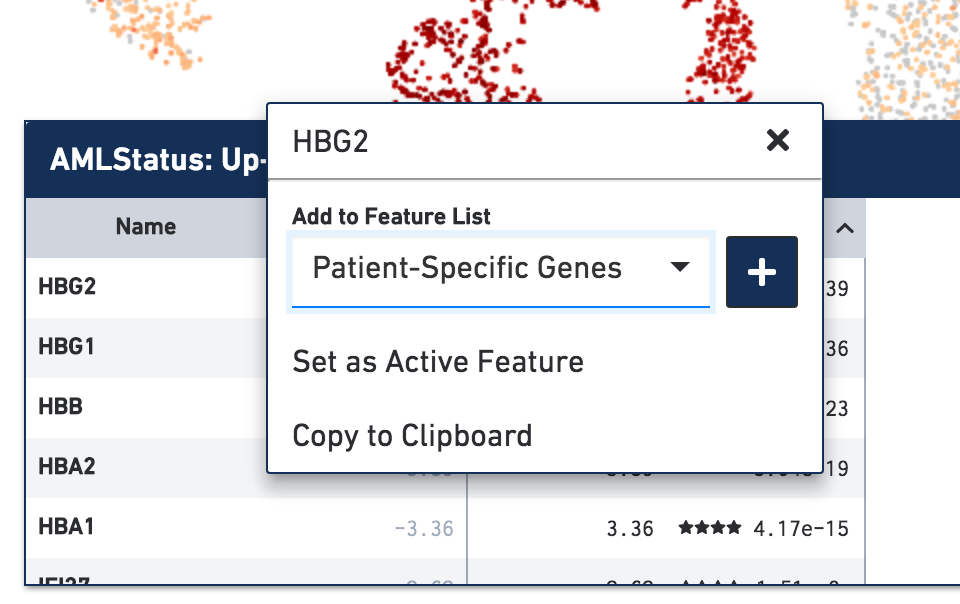
In previous versions of Loupe Cell Browser, clicking on a gene in the gene table would add the gene to the "Heatmap List". In Loupe Cell Browser 3.0, clicking a gene (or other feature) in the table will instead bring up a menu of options.

From this menu, there are options to assign a feature to an existing list, or create a new list. Choosing Set as Active Feature will highlight the expression or accessibility of the feature in the current plot, as in previous versions of Loupe Cell Browser. Selecting Copy to Clipboard copies the feature name to the system clipboard, making it easier to paste into other bioinformatics tools.