10x Genomics
Single Cell Gene Expression
Cell Ranger, printed on 07/17/2025
What's New in Loupe Cell Browser 2.0.0
NOTE: Loupe Cell Browser 2.0.0 includes all the new features of Loupe Cell Browser 1.0.5, which are described here in depth.
Integrated Gene Expression + V(D)J Clonotype Analysis
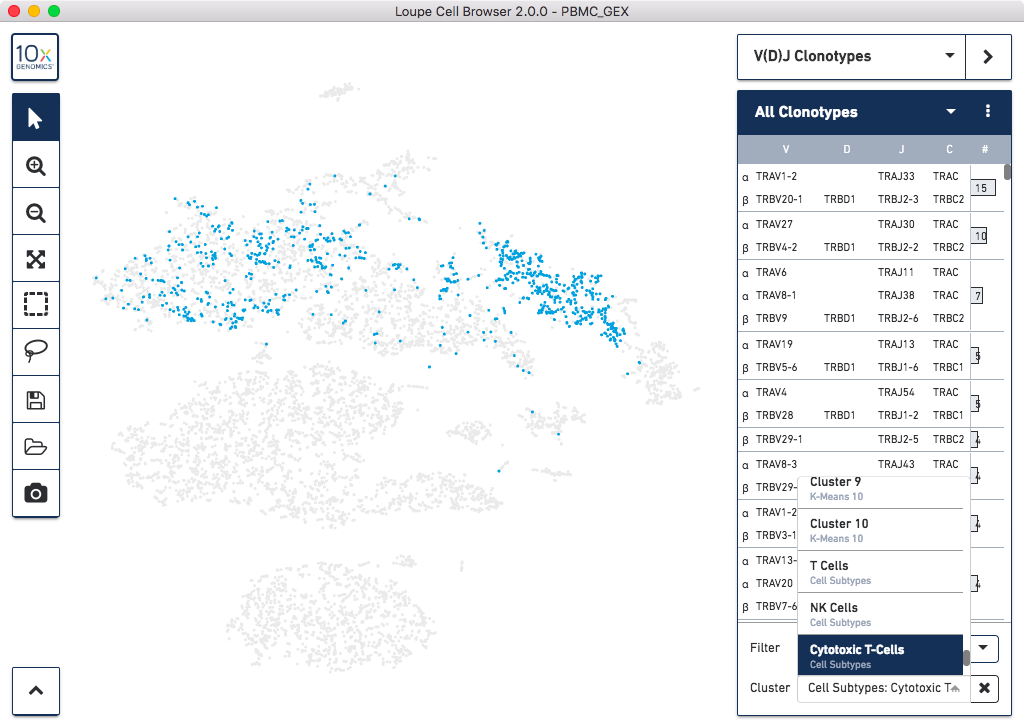
When using the combined 5′ Gene Expression with T Cell and B Cell Enrichment Kits, it is now possible to measure whole transcriptome gene expression and V(D)J repertoire diversity from the same sample. To facilitate this analysis, Loupe Cell Browser 2.0 allows you to combine the V(D)J and gene expression data with a few clicks:

To find out more about how to conduct an integrated experiment, consult the Single Cell Gene Expression + V(D)J page. For a complete Loupe how-to including some example data, go to Integrated Gene Expression and V(D)J Analysis in Loupe Cell Browser.
The complete list of V(D)J features in Loupe Cell Browser includes:
- Import one or more .vloupe files (e.g, T and B cell data) into a single .cloupe workspace
- Save and share loaded clonotype lists into the .cloupe file
- Visual overlays indicating location of cells in the visible clonotype list
- Filter clonotype list by gene expression cluster, gene names, and CDR3 motifs
- Filter between one or all .vloupe files at a time
- Highlight individual clonotypes in the clonotype list
- Create and save new clusters from selected clonotypes
- Toggle between gene names and CDR3 sequences of chains
- On import, detect whether a V(D)J dataset is associated with the loaded gene expression data
Additional Significant Gene Options
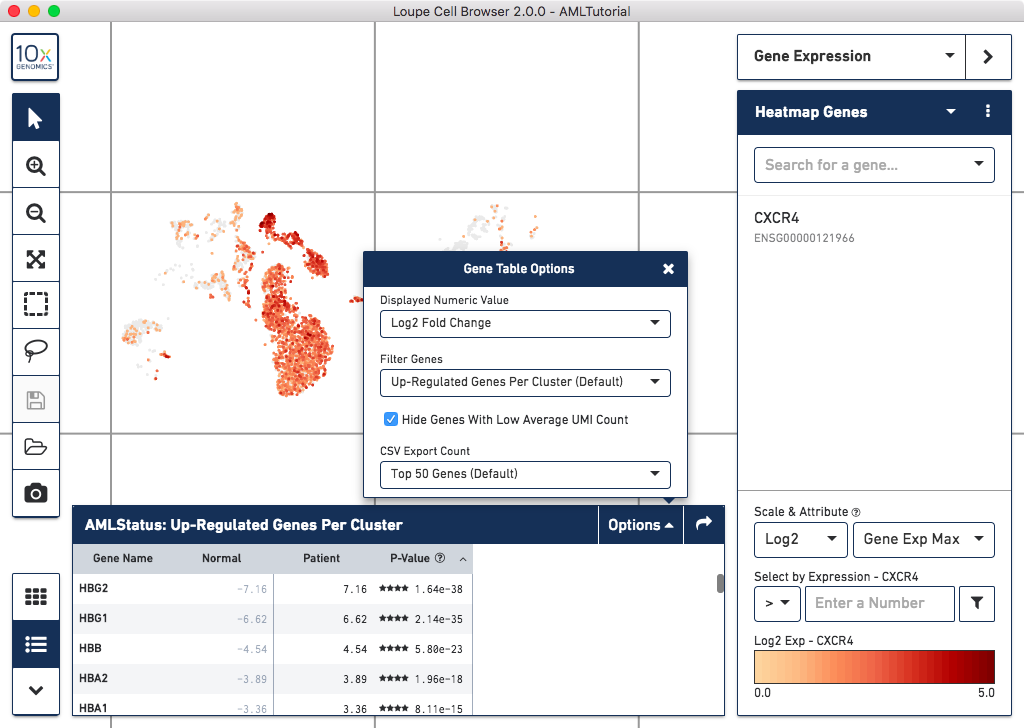
Loupe Cell Browser 2.0.0 removes most limits on the set of genes returned by calculating significant genes, and gives you several filtering options. Click on the Options button on the Significant Genes panel to see all options:

Changes include:
- The list now includes all genes that are upregulated in a cluster, and have a mean expression level across the dataset of one transcript per cell or higher. Previous behavior was to return the top 20 upregulated genes per cluster.
- It is now the default to sort significant genes by p-value. You can also sort by regulation change compared to mean.
- View the top upregulated genes per cluster, downregulated genes per cluster, all significant genes per cluster, or limit comparison to genes in the currently visible Gene Expression list.
- Optionally disable the low average transcript count filter, to show the expression level of all genes detected in the sample.
- Choose the top number of genes to display when exporting to CSV.
- The heatmap will now display the top upregulated genes per cluster by p-value.
Additional Fixes
- Added "Gene Exp Min" as a coloring and filtering option in gene expression, allowing you to view cells in which Gene 1 AND Gene 2 AND Gene 3 are expressed.
- Add option to change background color to black, via the View menu.
- More prevalent links to help and the online tutorial.
- Auto-detect when a user may need to upgrade video drivers on Windows, instead of crashing.
- Trigger Save As... when attempting to save a read-only file.
- Change bundled tutorial to read-only.