10x Genomics
Visium Spatial Gene Expression
Space Ranger1.3, printed on 07/08/2025
Image Outputs
The pipeline output contains a subdirectory named spatial which stores imaging related files. These files are useful to confirm fiducdial alignment and tissue detection. However, the user supplied original full resolution images are used for visualization in Loupe Browser. The imaging files include the following:
-
tissue_hires_image.png and tissue_lowres_image.png: These files are downsampled versions of the original, full-resolution brightfield image provided by the user. Downsampling is accomplished by box filtering, which averages RGB values in patches of pixels in the full-resolution image to obtain an RGB value of one pixel in the downsampled image. The
tissue_hires_image.pngimage has 2,000 pixels in its largest dimension, and thetissue_lowres_image.pnghas 600 pixels. -
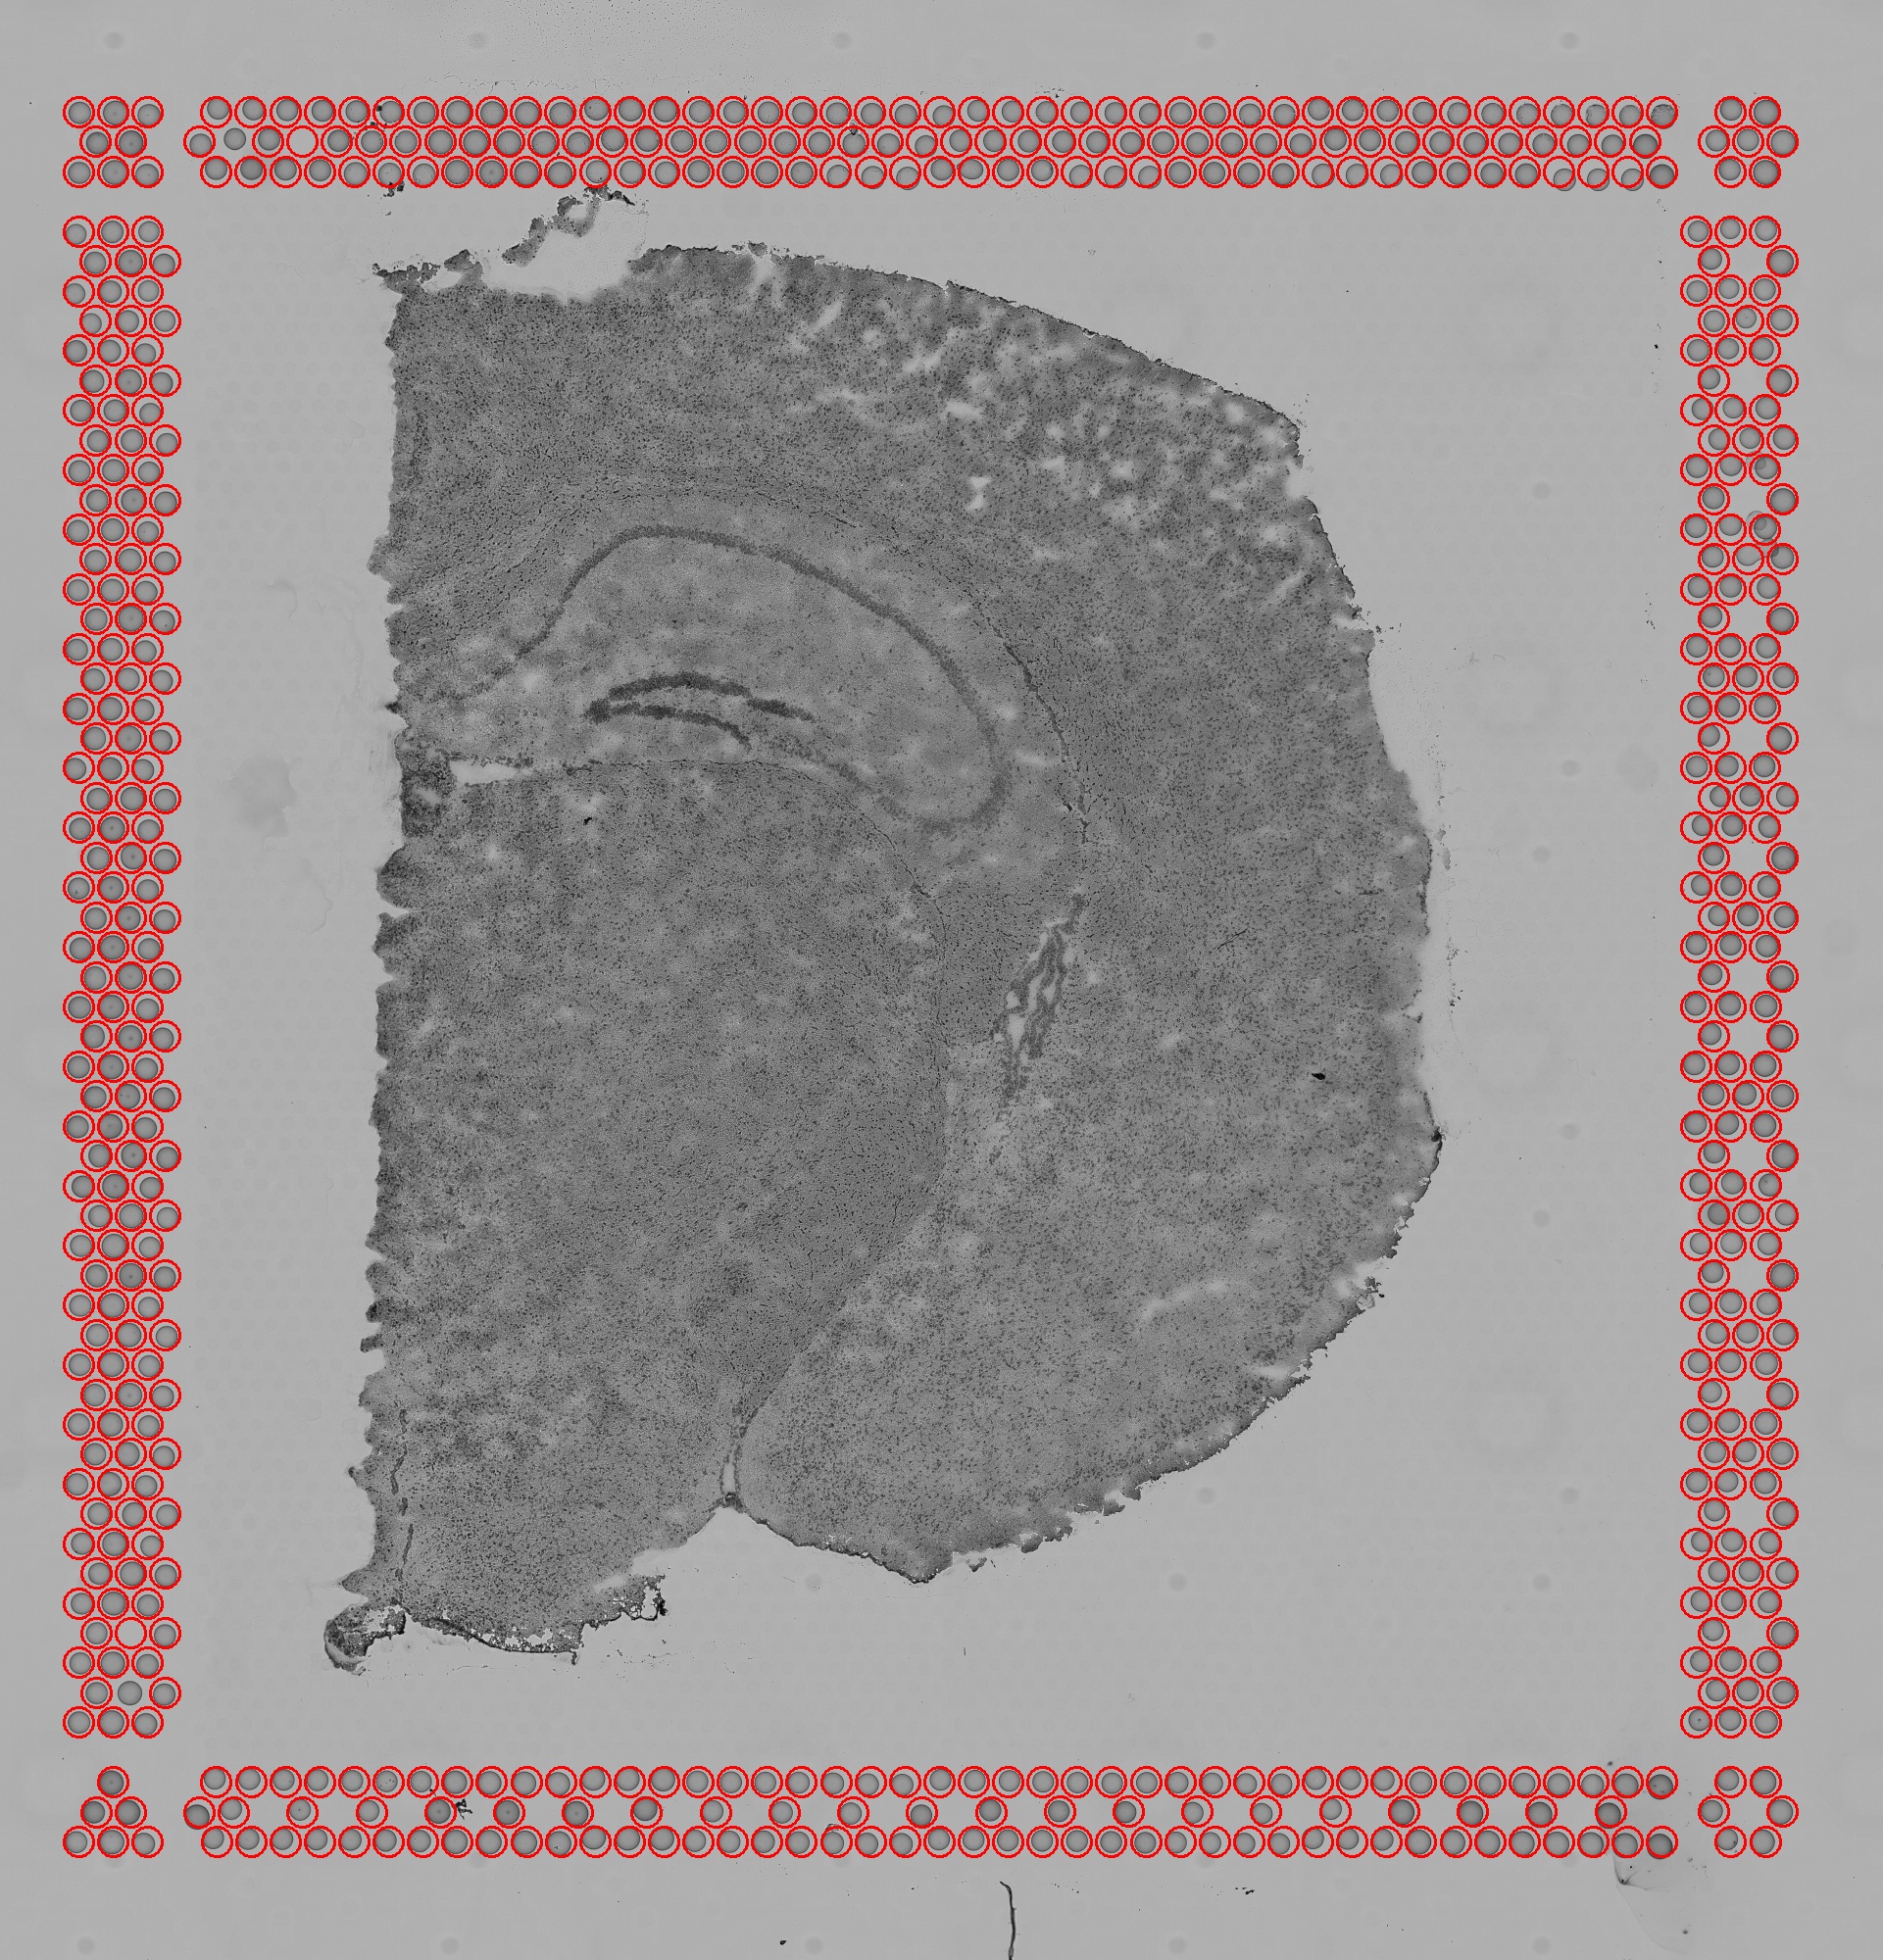
aligned_fiducials.jpg: This image has the dimensions of
tissue_hires_image.png. Fiducial spots found by the fiducial alignment algorithm are highlighted in red. This file is useful to verify that fiducial alignment was successful.

-
scalefactors_json.json: This file contains the following fields:
tissue_hires_scalef: A scaling factor that converts pixel positions in the original, full-resolution image to pixel positions intissue_hires_image.png.tissue_lowres_scalef: A scaling factor that converts pixel positions in the original, full-resolution image to pixel positions intissue_lowres_image.png.fiducial_diameter_fullres: The number of pixels that span the diameter of a fiducial spot in the original, full-resolution image.spot_diameter_fullres: The number of pixels that span the diameter of a theoretical 65µm spot in the original, full-resolution image.
  $ cd /home/jdoe/runs/sample345/outs/spatial
  $ cat scalefactors_json.json
  {"spot_diameter_fullres": 89.43834961021503,
  "tissue_hires_scalef": 0.17011142,
   "fiducial_diameter_fullres": 144.4773339857,
   "tissue_lowres_scalef": 0.051033426}
The example
scalefactors_json.jsonvalues are derived from the adult mouse brain dataset which includes an image with dimensions of 11291 x 11757. The scalefactor is calculated as scalefactor=target sizemax(original image width, original image height)Since the largest dimension for the
tissue_hires_image.pngis 2000 pixels, the scalefactor will be tissue_hires_scalef=200011757≈0.17011142Similarly for the
tissue_lowres_image.png, the largest dimension is 600 pixels and the scalefactor is tissue_lowres_scalef=60011757≈0.051033426The spot diameter and fiducial diameter are estimated fractional pixels of the spot diameter in the original image. It is estimated based on the registration solution and the known size of the spots and fiducial frame and does not use a priori knowledge of the image pixel sizes. For this example the estimated pixel size was can be calculated from the spot diameter for the full resolution image microns/pixels=6589.43834961≈0.7267575965
-
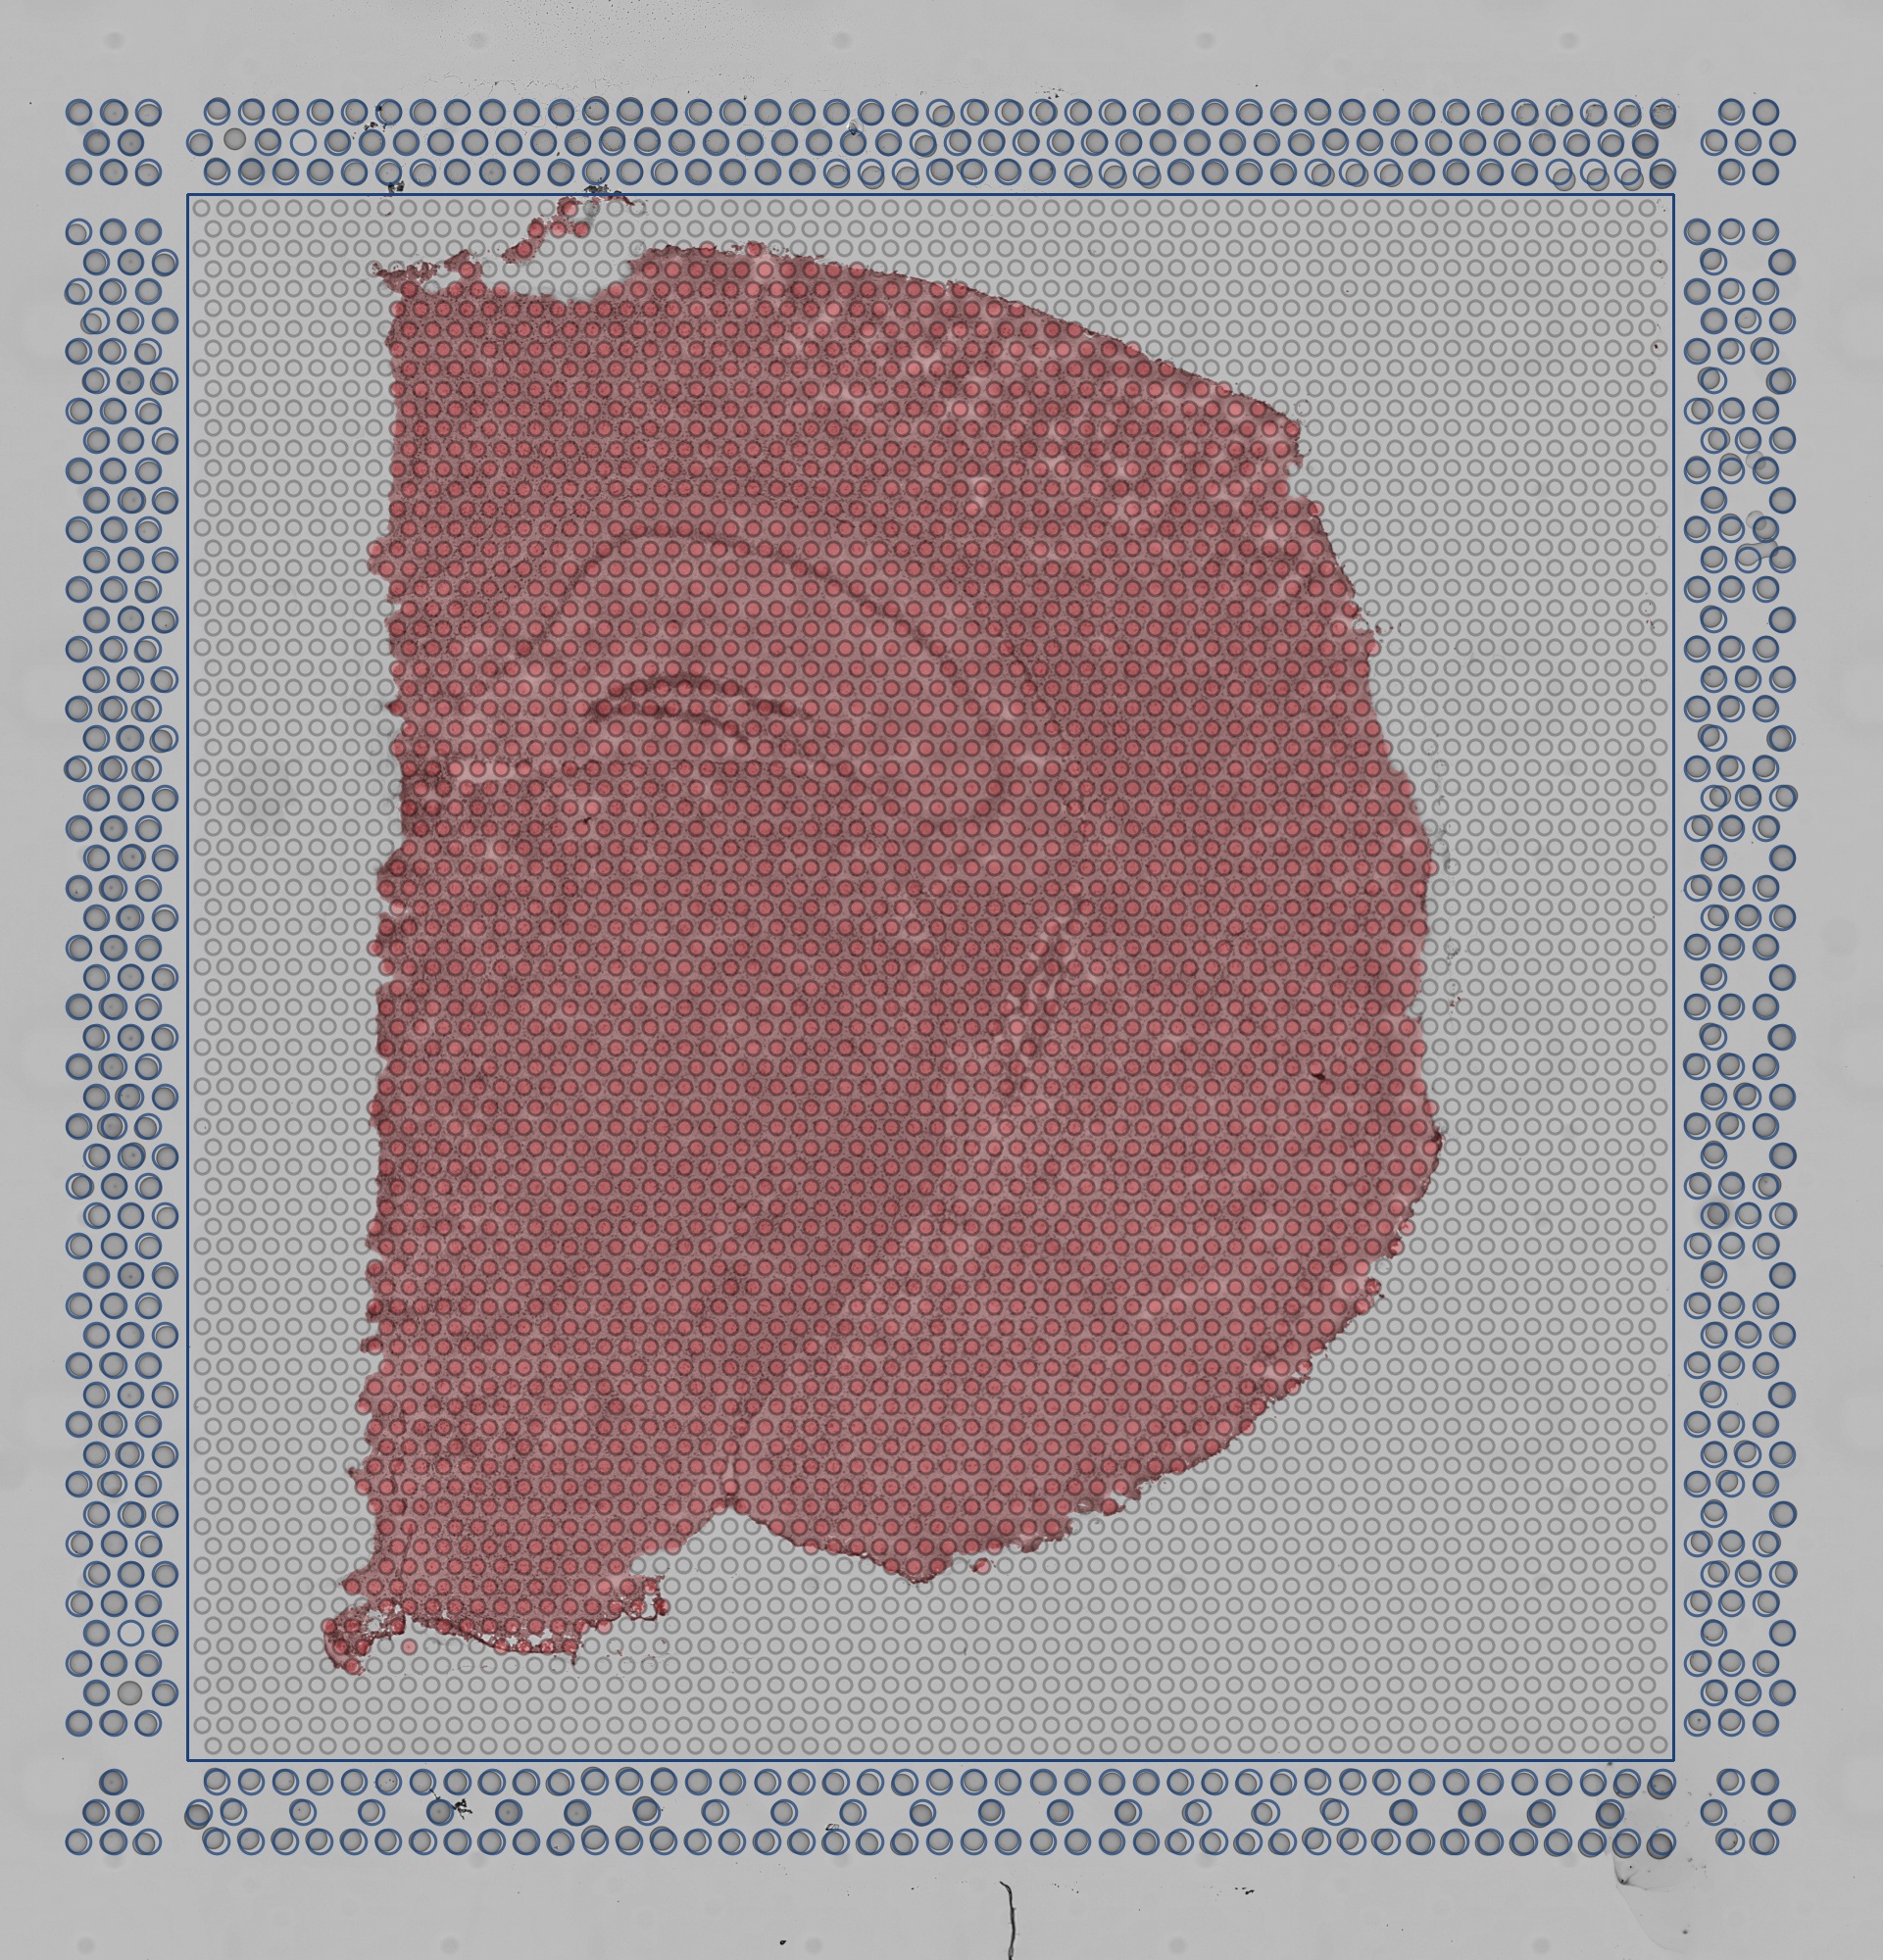
detected_tissue_image.jpg: This image has the dimensions of the
tissue_hires_image.pngand shows the following:- Aligned fiducial spots as blue, hollow circles.
- A blue bounding box. The interior designates the portion of the image where tissue is discriminated from background.
- Spots found under tissue are red.
- Spots outside of tissue are gray.

-
tissue_positions_list.csv : This text file contains a table with rows that correspond to spots. It has 4,992 rows, which is the number of spots in the spatial array. Columns, whose names are not specified in the file, correspond to the following fields:
barcode: The sequence of the barcode associated to the spot.in_tissue: Binary, indicating if the spot falls inside (1) or outside (0) of tissue.array_row: The row coordinate of the spot in the array from 0 to 77. The array has 78 rows.array_col: The column coordinate of the spot in the array. In order to express the orange crate arrangement of the spots, this column index uses even numbers from 0 to 126 for even rows, and odd numbers from 1 to 127 for odd rows. Notice then that each row (even or odd) has 64 spots.pxl_row_in_fullres: The row pixel coordinate of the center of the spot in the full resolution image.pxl_col_in_fullres: The column pixel coordinate of the center of the spot in the full resolution image.
  $ cd /home/jdoe/runs/sample345/outs/spatial
  $ column -s, -t < tissue_positions_list.csv | head -n 10
  ACGCCTGACACGCGCT-1  0  0   0    1251   1210
  TACCGATCCAACACTT-1  0  1   1    1371   1279
  ATTAAAGCGGACGAGC-1  0  0   2    1251   1348
  GATAAGGGACGATTAG-1  0  1   3    1371   1417
  GTGCAAATCACCAATA-1  0  0   4    1251   1486
  TGTTGGCTGGCGGAAG-1  0  1   5    1371   1554
  GCATCCTCTCCTATTA-1  0  0   6    1251   1623
  GCGAGGGACTGCTAGA-1  0  1   7    1371   1692
  TGGTACCGGCACAGCC-1  0  0   8    1251   1761
  GCGCGTTTAAATCGTA-1  0  1   9    1371   1830
The spots are arranged using a orange crate packing to maximize packing density. Further explanation of this arrangement can be found in this article.
Note that the tissue_positions_list.csv contains the same information about the barcode whitelist and their slide coordinates as that contained in the barcodes folder that comes bundled with Space Ranger (spaceranger-x.y.z/lib/python/cellranger/barcodes where x.y.z represent the version number).
- 1.0
- 1.1
- 1.2
- 2.0 (latest)
- Space Ranger v1.3