10x Genomics
Chromium Single Cell Immune Profiling
Cell Ranger3.0, printed on 02/27/2025
Integrated V(D)J and Gene Expression Analysis in Loupe Cell Browser
Overview
In this analysis walkthrough, you will investigate the clonality and diversity of lymphocytes within a non-small cell lung carcinoma sample, look at the distribution of clonotypes within two T cell phenotypes, and explore a well-conserved clonotype motif in gene expression data. For this tutorial, you will need to download the latest versions of Loupe Cell Browser and Loupe V(D)J Browser, in addition to downloading a few data files:
- Download Loupe Cell Browser 3.0.1
- Download Loupe V(D)J Browser 3.0.0
- Download Lung Carcinoma Gene Expression .cloupe file
- Download Lung Carcinoma T Cell .vloupe file
If you're new to Loupe Cell Browser, you may want to read the Loupe Cell Browser tutorial before continuing. For more information on how to set up integrated V(D)J and gene expression experiments, go back to the Single Cell V(D)J + 5′ Gene Expression overview.
Loading the Lung Tumor Dataset
Open the LungTumorGEX.cloupe file in Loupe Cell Browser. In Categories
mode, if you select Cell Types from the Category select menu, you will see the plot below:
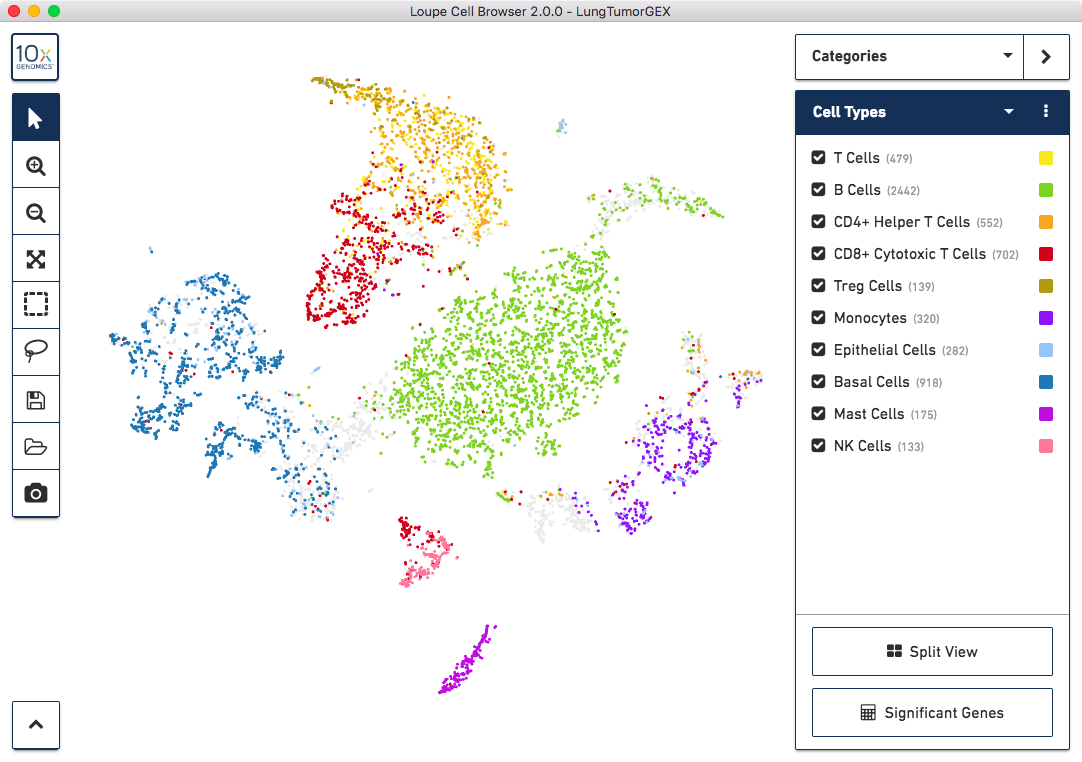
We have manually annotated this dataset using Loupe Cell Browser, using gene markers (also saved with the dataset) to determine cell types. You can see large clusters of CD8+ cytotoxic T cells (red), CD4+ helper T Cells (orange), other T cells (yellow), B cells (green), and lung epithelial and basal cells (blue, dark blue). For more information on how to create cell types using gene markers, visit the Exploring Substructure tutorial in the Loupe Cell Browser documentation.
Importing Clonotypes
Importing a .vloupe file into the workspace
will allow you to explore the clonotypes within gene expression clusters. To do so, select
V(D)J Clonotypes from the mode selector at upper right, and either select
Import Clonotypes from the sidebar action menu, or click on the link inside the sidebar:
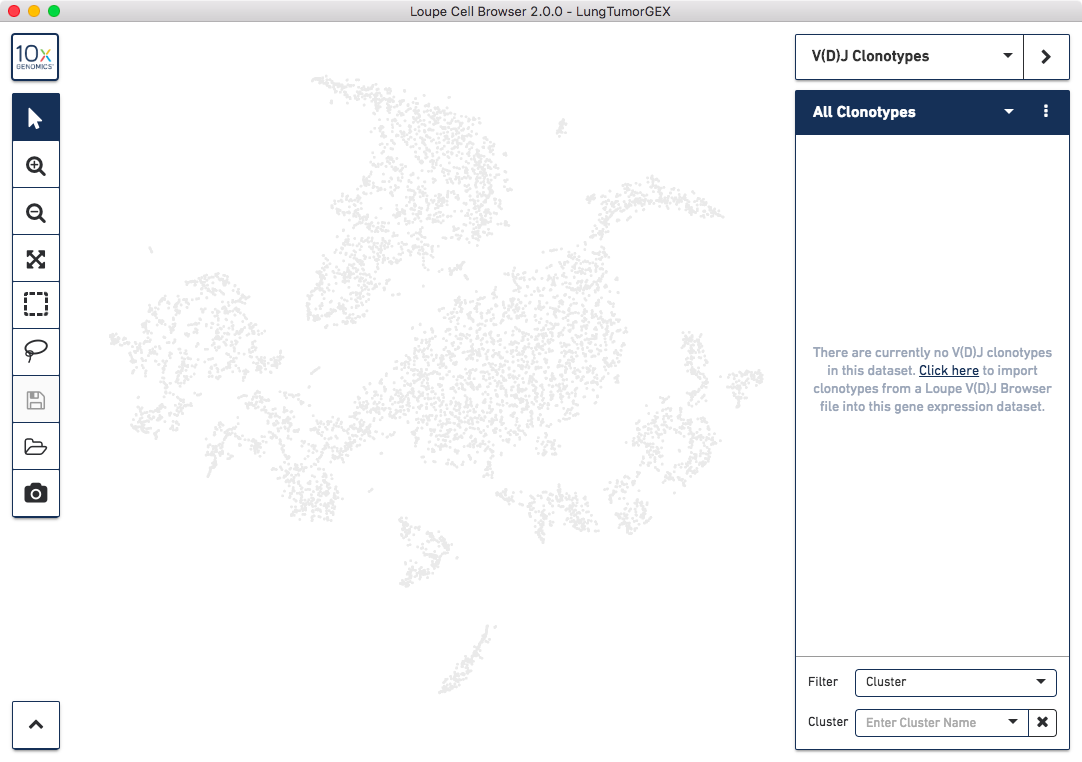
Select the LungTumorT.vloupe file you downloaded from the links above. You'll see the sidebar
populated with the list of paired clonotypes from the V(D)J data, and the cells from
the complete T-cell receptor clonotype list highlighted in blue:
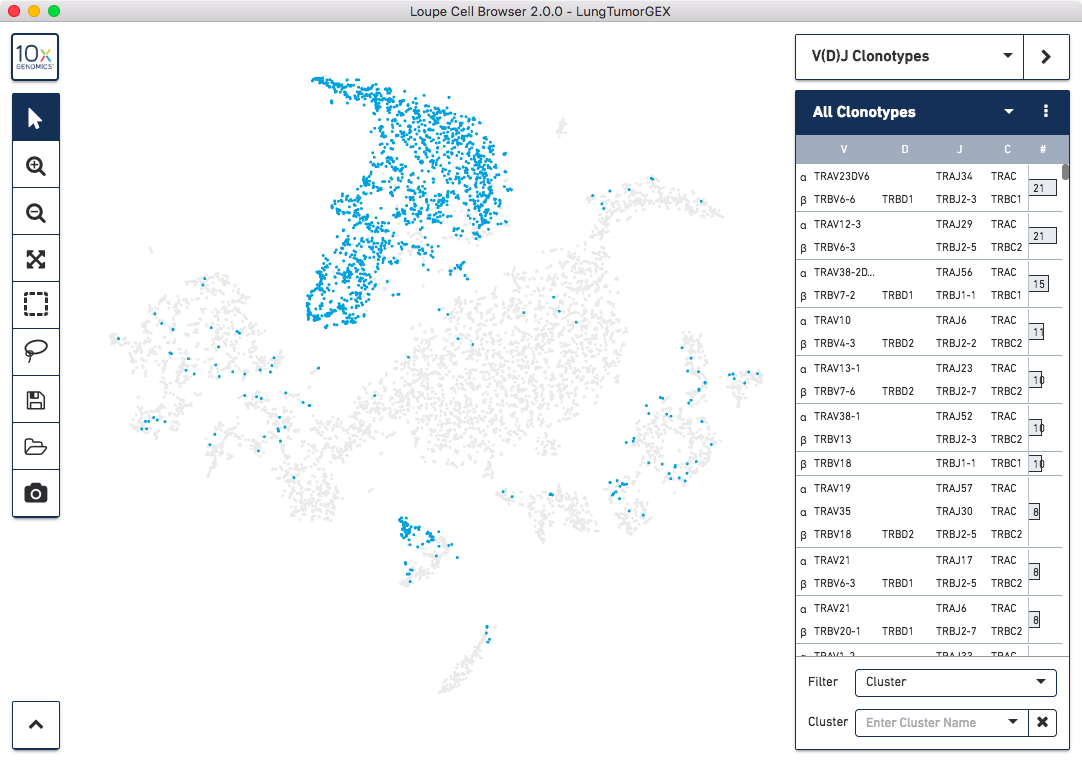
The numbers to the right of the clonotype list are the number of cells within that V(D)J clonotype that were also found in the gene expression dataset. Because the barcoding happened before the sample was divided into V(D)J and gene expression libraries, the same cells appear in both data sets, and the barcodes match.
The sidebar dropdown menu has options to toggle between listing clonotypes by gene segments or CDR3 sequences associated with each chain, select all clonotypes in the active list, and import or remove clonotype lists. It is possible to load multiple V(D)J files for a single gene expression file, such that one can look at T cell clonotypes, B cell clonotypes, and gene expression data all in the same view.
Associating Clonotypes with Phenotypes
One key benefit of running an integrated gene expression and V(D)J experiment is the ability to associate phenotypes with clonotypes of interest. There are a few ways to do this in Loupe Cell Browser.
To quickly identify the phenotype of the top T cell clonotypes, switch back to Categories mode and select Split View. The plot will be divided into 11 clusters. Hovering the pointer over the cells in a given cluster will display the name of that cluster. You can see that the CD4+ helper T cells are in the third box on the top row, CD8+ cytotoxic T cells are at upper right, CD4-/CD8- T cells are at upper left, and Treg cells are directly below those in the first box on the second row.
Now switch back into V(D)J Clonotypes mode. You can highlight the location of the cells of a single clonotype by clicking on the clonotype in the sidebar. The top clonotype, highlighted in dark blue, falls exclusively within the top right CD8+ cytotoxic T cell cluster, as shown below:
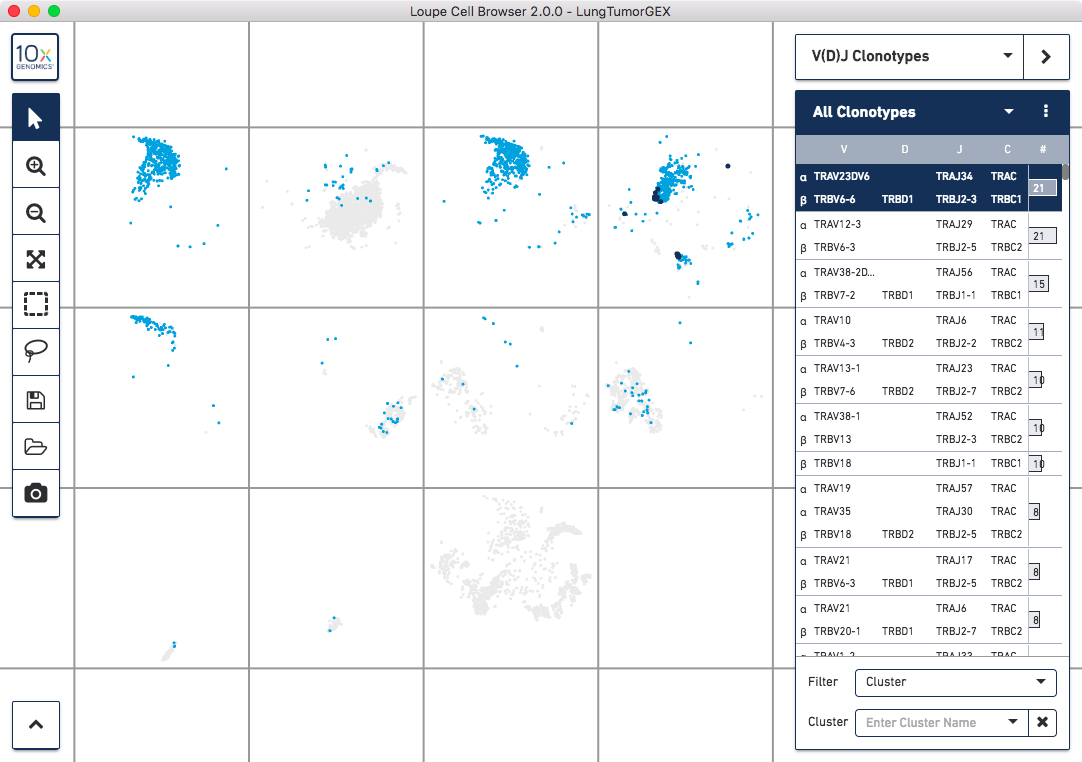
Clicking on the top few clonotypes will show that the most abundant clonotypes here are often those of cytotoxic T cells.
Another way of looking at the relation between phenotype and clonotype is to filter the clonotype list by a gene expression cluster. To do so, select Cluster from the Filter selector in the sidebar, and then start typing the name of the cluster in the Cluster field. As you type, the field will offer autocomplete suggestions. Selecting the CD4+ helper T Cell cluster will show the complete list of clonotypes among the cells in that group, and highlight only those cells in the plot:
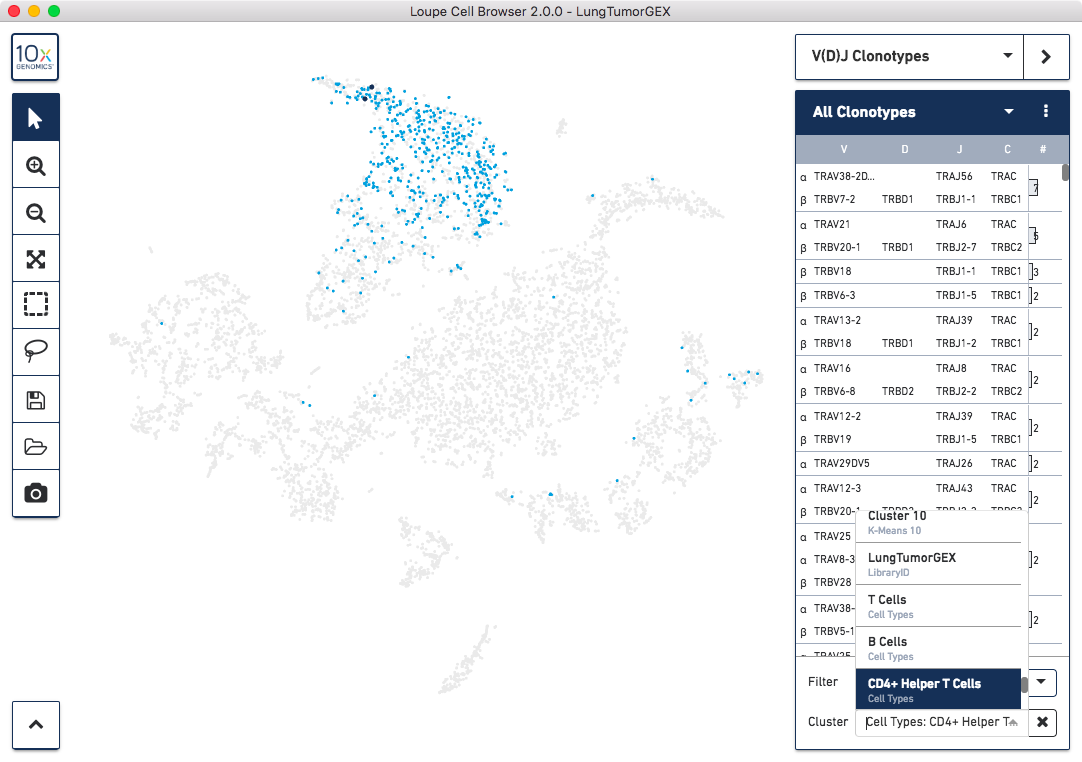
You can see there are a few expanded helper T cell clones as well.
Creating Clusters from Clonotypes
Finally, let's create a new cluster from the clonotypes themselves. MAIT cells (mucosal associated invariant T cells) are a subset of T cells that guard against microbial activity and infection, and have a semi-invariant TCR alpha chain, derived from the TRAV1-2 V gene and one of TRAJ12, TRAJ20, and TRAJ33 J gene segments. MAIT cells typically make up a small percentage of all T cells in a healthy donor. Let's put the MAIT cells into their own cluster within the Cell Types category.
To identify MAIT cells, choose the Gene Name option for the Filter field, and start typing the names of the segments in the Genes box. You can select one V-J pair at a time; the dominant pair is TRAV1-2 and TRAJ33. After filtering, you can choose the Select All Clonotypes option from the action menu to highlight all clonotypes in the list. (You can also click on a single clonotype to highlight it, or use the Command key (Mac) or Control key (Windows) to highlight multiple clonotypes at once.) Right-click on the selected clonotypes to bring up the context menu, as shown below:
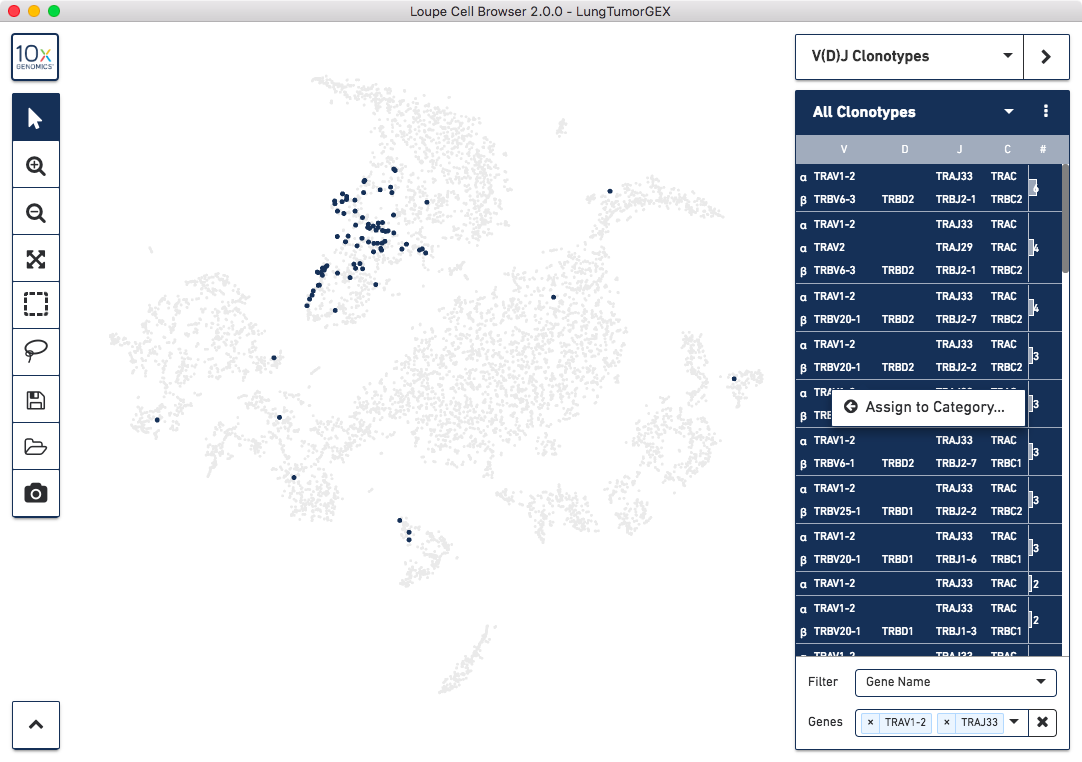
Click on Assign to Category to bring up the cluster assignment popup. Choose Cell Types as the category, and create a new MAIT Cells cluster:
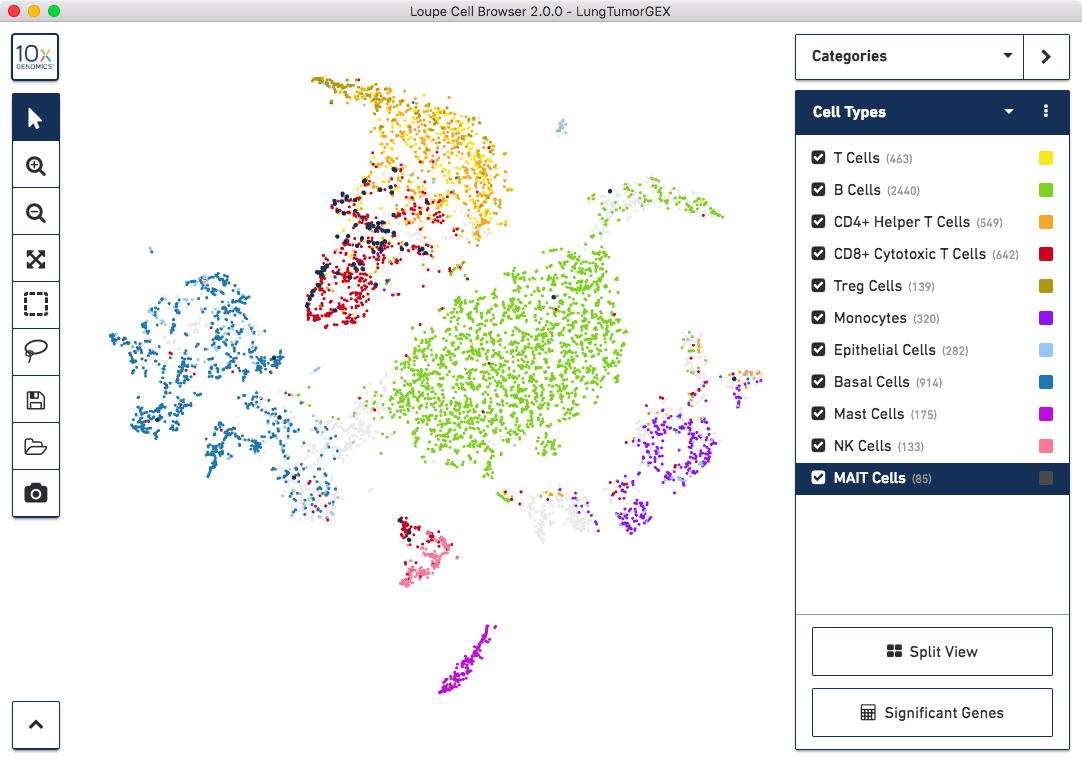
You can delete TRAJ33 from the genes filter, and repeat the process for the TRAJ12 and TRAJ20 genes, adding them to your MAIT group. You can save this cluster to the .cloupe file by clicking on the Save icon in the toolbar, or by selecting Save or Save As from the File menu.
Next Steps
Next, we will use Loupe V(D)J Browser to further interrogate T cell clonotypes, and compare distributions of clonotypes between different gene expression clusters.