10x Genomics
Visium Spatial Gene Expression
Space Ranger2.0 (latest), printed on 07/29/2025
What is Space Ranger?
Visium Spatial Gene Expression is a next-generation molecular profiling solution for classifying tissue based on total mRNA. Space Ranger is a set of analysis pipelines that process Visium Spatial Gene Expression data with brightfield and fluorescence microscope images. Space Ranger allows users to map the whole transcriptome in formalin fixed paraffin embedded (FFPE) and fresh frozen tissues to discover novel insights into normal development, disease pathology, and clinical translational research.
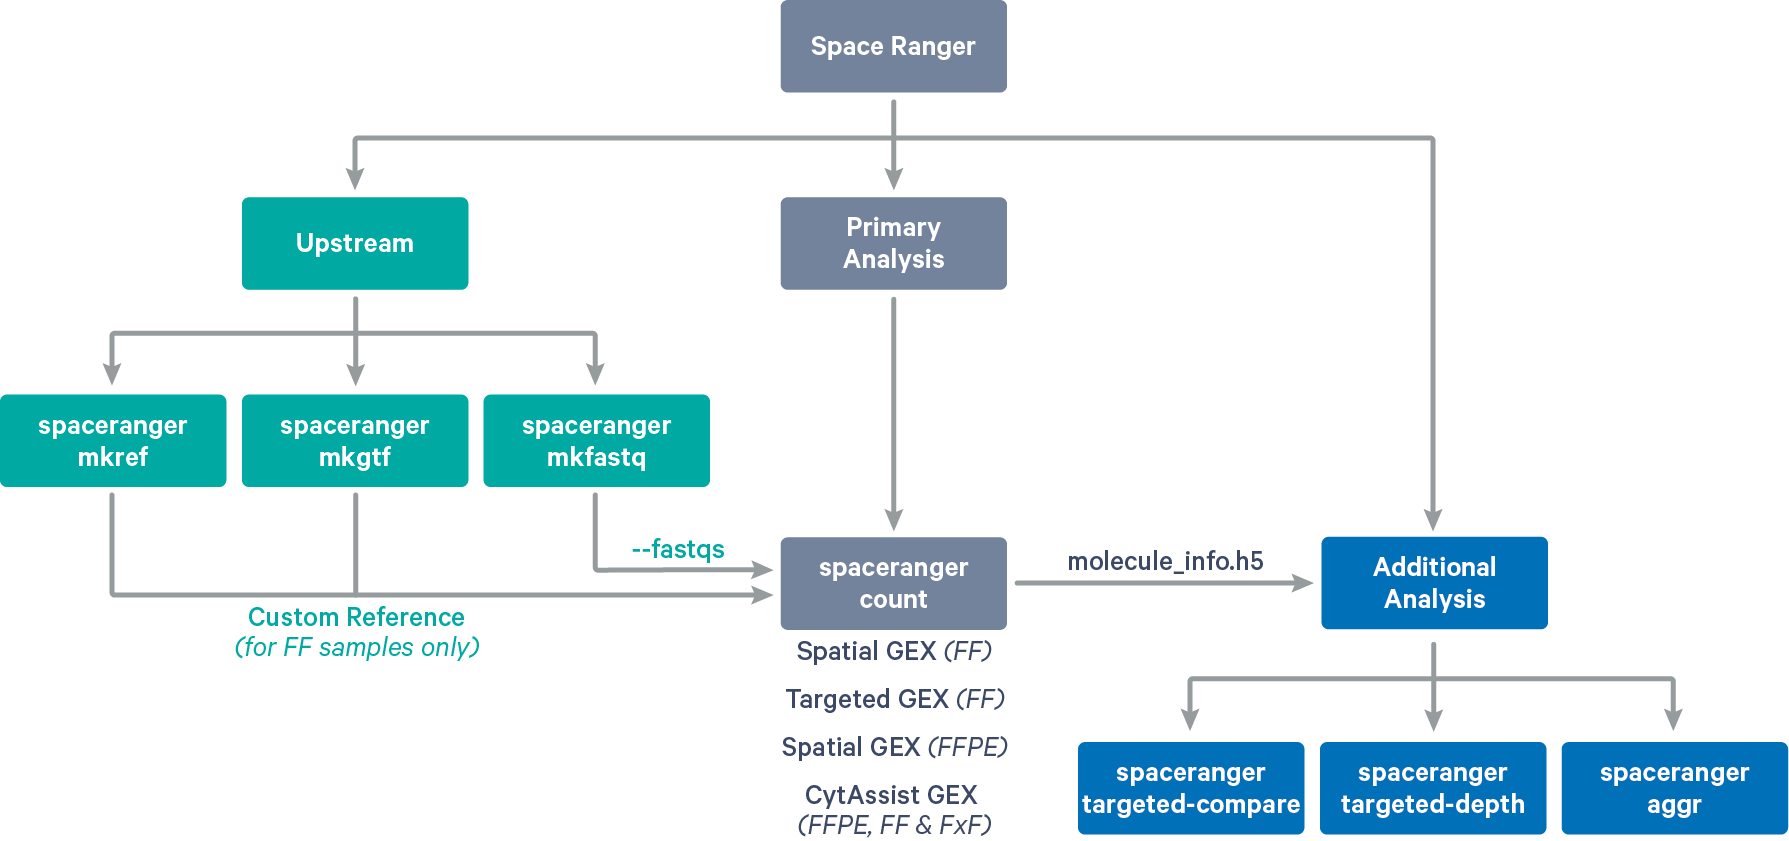
Space Ranger provides pipelines for end to end analysis of Visium Spatial Gene Expression experiments (see supported libraries):

-
spaceranger mkfastq demultiplexes Visium-prepared raw base call (BCL) files generated by Illumina sequencers into FASTQ files. It is a wrapper around Illumina's bcl2fastq with additional features that are specific to 10x Genomics libraries and a simplified sample sheet format.
-
spaceranger count takes a microscope slide image and FASTQ files and performs alignment, tissue detection, fiducial detection, and barcode/UMI counting. The pipeline uses the Visium spatial barcodes to generate feature-barcode matrices, determine clusters, and perform gene expression analysis. In addition to fresh-frozen tissues, spaceranger count is also used for single-library analysis of FFPE and Targeted Gene Expression. spaceranger count also supports CytAssist enabled Gene Expression analysis which includes additional steps of image registration between CytAssist and microscope image if provided.
-
spaceranger aggr takes the output of multiple runs of spaceranger count from related samples and aggregates their output, normalizing those runs to the same sequencing depth, and then recomputing the feature-barcode matrices and the analysis on the combined data. The aggr pipeline combines data from multiple samples into an experiment-wide feature-barcode matrix and analysis. This pipeline is supported for both fresh-frozen and FFPE tissues, although the aggregated libraries must be of the same type.
-
spaceranger targeted-compare compares a starting input library, referred to as the parent library, to its corresponding Targeted Gene Expression dataset. spaceranger targeted-compare can be used to assess targeting performance with greater accuracy than when only the targeted data are known. Quality control metrics are provided to verify the extent to which targeted genes were enriched and the parent sample data were recovered. This pipeline is only supported for fresh-frozen tissues.
-
spaceranger targeted-depth summarizes a whole transcriptome analysis (WTA) dataset in the context of a hypothetical Targeted Gene Expression experiment. Given an existing WTA dataset and a target panel CSV file, spaceranger targeted-depth computes the fraction of reads mapped to targeted genes from the panel. This pipeline is only supported for fresh-frozen tissues.
| After June 30, 2023, new Space Ranger releases will no longer support targeted gene expression analysis. |
Brightfield and Fluorescence Imaging
Space Ranger takes a slide image as input to be used as an anatomical map on which gene expression measures are visualized. Space Ranger can take two styles of images: either a brightfield image stained with hematoxylin and eosin (H&E) with dark tissue on a light background, or a fluorescence image with bright signal on a dark background. While brightfield input comprises a single image, fluorescence input comprises one or more channels of information generated by separate excitations of the sample.
Automatic and Manual Image Processing Workflows
Space Ranger combines algorithms for processing Visium slide images with the robust gene expression analysis used in Space Ranger.
The spaceranger count pipeline performs the following automated image processing tasks:
- Alignment of the slide's barcoded spot pattern to the input slide image. (Brightfield only)
- Discrimination between tissue and background in the slide image. (Brightfield only)
- Alignment of CytAssist image and microscope image of the same tissue section. (Optional, CytAssist Workflow only)
- Preparation of the full-resolution slide image for visualization in Loupe Browser.
These image processing tasks are described further in the Image Processing section. We encourage you to read Image Recommendations for imaging suggestions prior to data collection.
The automated alignment and tissue identification processes require images taken with proper tissue placement and image exposure and currently only works for brightfield images. Samples with fluorescence images or brightfield images where these conditions cannot be met can be processed by using manual fiducial alignment wizard in Loupe Browser to manually align the spot pattern and identify tissue in the slide image. When this manual workflow is chosen, the spaceranger count pipeline will still take the full resolution image or images as input in order to prepare data for visualization within Loupe Browser.
For the CytAssist workflow, the automatic image registration process will align the CytAssist image with the microscope image of the same tissue tissue captured on standard glass slide. A manual counterpart of this process is available in Loupe Browser as the CytAssist image alignment wizard where landmark-based point selection helps identify equivalent regions between the two image inputs.
Irrespective of the manual workflow performed, both the Loupe Manual Aligner and Space Ranger must be given the same set of images for a given sample.
Chemistry
Libraries supported
The library support of Space Ranger 2.0 and previous versions is summarized in the table below.
| Visium Spatial Gene Expression Solution | SR 2.0 | SR 1.3 | SR 1.2 | SR 1.0 |
|---|---|---|---|---|
| Visium Spatial Gene Expression Libraries | ||||
| Visium Targeted Gene Expression Libraries | ||||
| Visium Spatial Gene Expression for FFPE Libraries | ||||
| CytAssist Spatial Gene Expression for FFPE Libraries | ||||
| CytAssist Spatial Gene Expression for Fresh Frozen Libraries | ||||
| CytAssist Spatial Gene Expression for Fixed Frozen Libraries |